# View Pipeline and Deployment Results
Before starting this section, please ensure that you have read the Main Process section to understand the main process and related terminology for running pipelines and deploying applications in Nautes, and you have created at least one pipeline runtime or deployment runtime.
You can view the pipeline information using the Tekton Dashboard and the image repository console, and view the deployment information of the applications using the ArgoCD console and the kubectl command line.
# View Pipeline
# View Resources in Tekton Dashboard
You can view the pipelines in the Tekton Dashboard installed in the runtime cluster by using a browser to access https://$tekonHost:$traefik-httpsNodePort.
Replace the $tekonHost variable with the tekonHost address of the runtime cluster. For more information, refer to
spec.tekonHostin the property template in the Register Physical Cluster or Register Virtual Cluster section, for example,tekton.vcluster-aliyun.8.217.50.114.nip.io.Replace the $traefik-httpsNodePort variable with the traefik port of the runtime cluster. For more information, refer to
spec.traefik.httpsNodePortin the property template in the Register Physical Cluster or Register Virtual Cluster section, for example,30443.
When you access the Tekton Dashboard, if you haven't logged into the GitLab in the current browser session, the action will trigger unified authentication. During the authentication process, you need to enter your GitLab account and password to log in. After successful login, the page will automatically redirect to the Tekton Dashboard.
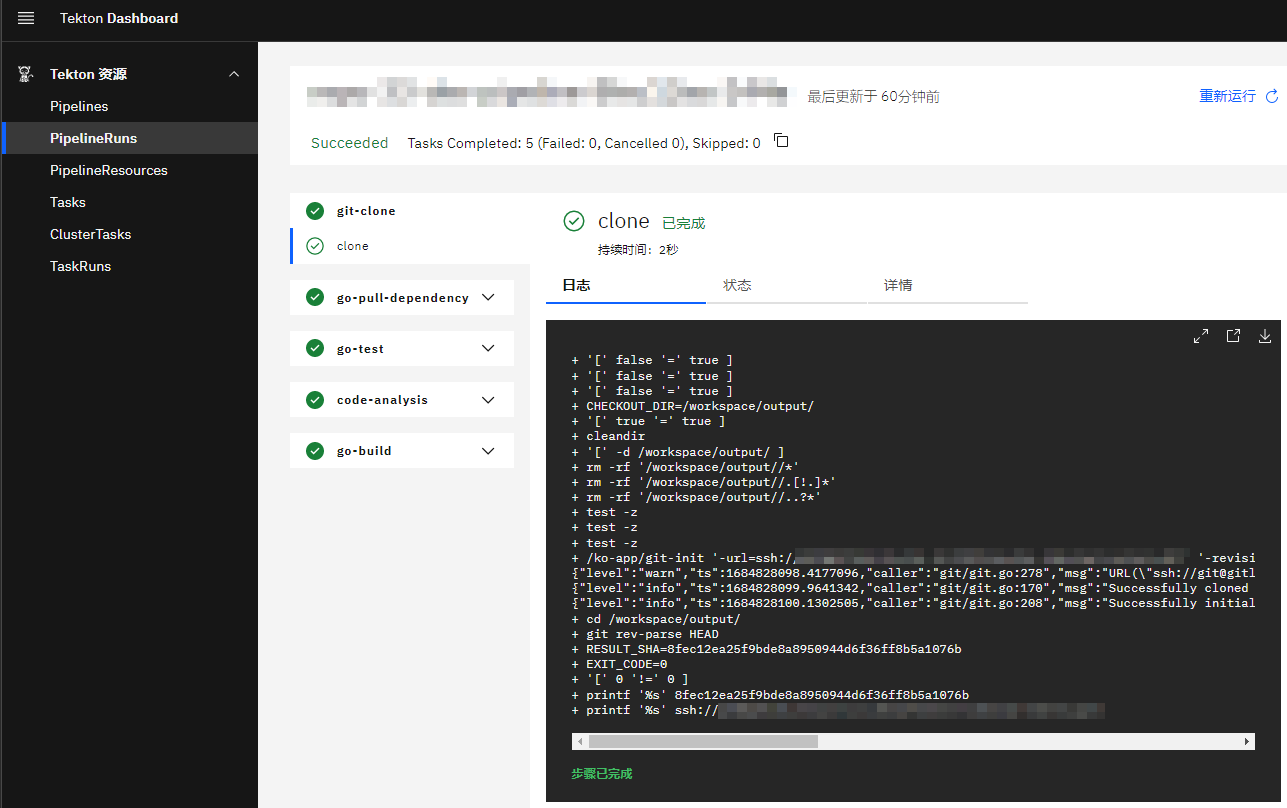
The Tekton Dashboard will present the namespaces authorized for you (with the same name as the project pipeline runtimes) and their related resources, including pipelines, pipelineruns, tasks, taskruns, and pipelineresources, etc.
By clicking on a pipeline record, you can view YAML, create pipelineruns, and view related pipelineruns. By clicking on a pipelinerun record, you can view the status, execution time, and running time of the pipelinerun, the parameters, status, logs, and YAML of the taskruns, and perform operations such as rerunning, starting and stopping, and deleting the pipelinerun.
# View Images in Image Repository
If the pipelines include tasks to build images and have been successfully executed, you can view the newly added images in the image repository (for example: https://github.com/orgs/nautes-labs/packages). To pull the images, you can use a similar command.
docker pull ghcr.io/nautes-labs/devops-sample:0.0.1-bdcdba83f17169db12e95bc9ff0592ace612016b
# View Image Configuration in Deployment Manifest
If the pipelines include tasks to update Kubernetes manifests and have been successfully executed, you can observe that the container image tags have been automatically updated to the versions containing the latest commit ID in the files within the deployment configuration repository (for example: deployments/test/devops-sample.yaml). The configuration snippet is as follows:
spec:
  template:
    spec:
      containers:
        - name: ks-sample
          image: ghcr.io/nautes-labs/devops-sample:0.0.1-bdcdba83f17169db12e95bc9ff0592ace612016b
# View Deployment Results
# View Resources in ArgoCD
Access the ArgoCD console installed on the runtime cluster by using a browser to access https://$argocdHost:$traefik-httpsNodePort. Click LOG IN VIA DEX for unified authentication. If you haven't logged into GitLab in the current browser session, you'll need to enter your GitLab account and password to log in. After successful login, the page will automatically redirect to the ArgoCD console.
Replace the $argocdHost variable with the argocdHost address of the runtime cluster. For more information, refer to
spec.argocdHostin the property template in the Register Physical Cluster or Register Virtual Cluster section, for example,argocd.vcluster-aliyun-0412.8.217.50.114.nip.io.Replace the $traefik-httpsNodePort variable with the traefik port of the runtime cluster. For more information, refer to
spec.traefik.httpsNodePortin the property template in the Register Physical Cluster or Register Virtual Cluster section, for example,30443.
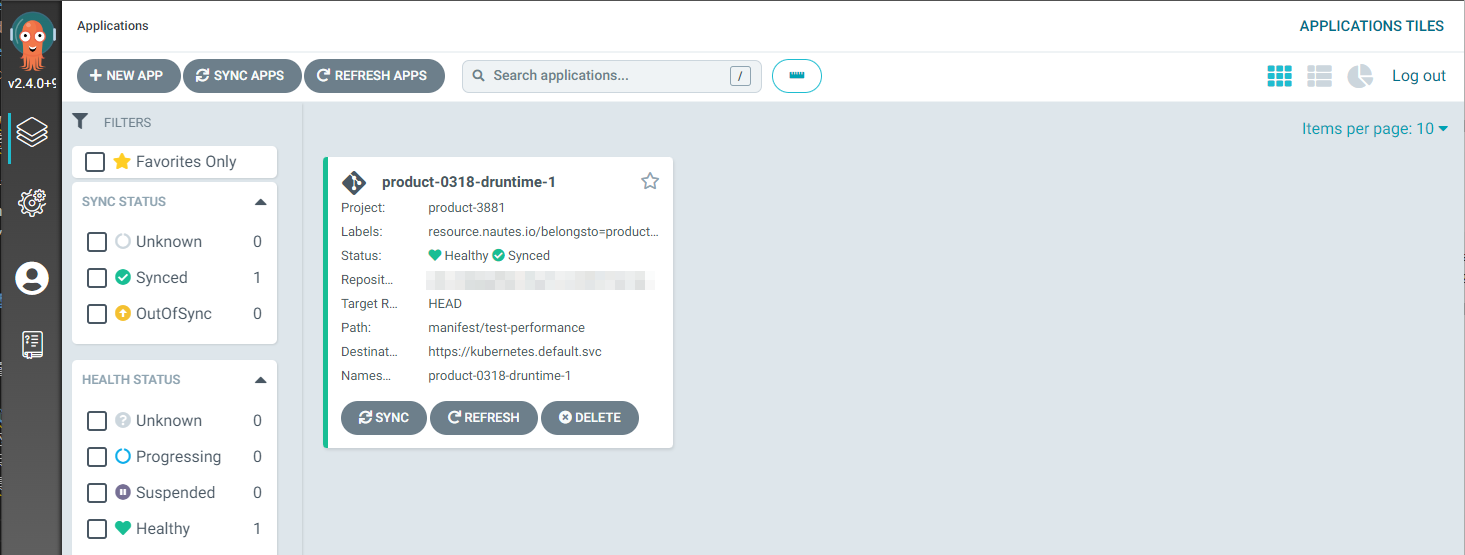
The ArgoCD console lists ArgoCD applications related to products authorized for you, and you will be able to view and manage related resources. By clicking on an ArgoCD application card, you can view the resource manifest, YAML, events, logs, and perform operations such as synchronization, restart, and deletion. By clicking on "Settings" in the left menu bar of the ArgoCD console, you can also view ArgoCD projects related to authorized products.
# View Resources in Kubernetes
You can perform unified authentication using a standard OIDC client and obtain an ID Token, and use the ID Token as an authentication credential for kubectl to access Kubernetes as an authenticated user on the server. The section describes how to perform unified authentication and obtain an ID Token using an example client provided by DEX.
You can obtain the source code of the client (opens new window), and compile the source code into a binary file. You can start the client using the following command, and the client will provide a WEB UI for unified authentication and return the authentication result.
./example-app \
 --client-id "$client_id" \
 --client-secret "$client_secret" \
 --issuer "$dex_url" \
 --issuer-root-ca "$dex_ca" \
 --listen "http://0.0.0.0:5555" \
 --redirect-uri "http://$ip:5555/callback" > /tmp/dex-client.log 2>&1 &
The variables $client_id and $client_secret are the client secrets issued by DEX, $dex_url is the service address of DEX, $dex_ca is the HTTPS certificate of DEX, and $ip is the IP address of the server where the client is running.
In order to access the client WEB UI, you also need to add an inbound rule for port 5555. Visit the ArgoCD of the Tenant Management Cluster and add the redirect URI of the client under the data.staticClients.id[0].redirectURIs path in the dex ConfigMap of the nautes Application.
After the service is started, you can access the client on port 5555, fill in the Extra scopes with groups, and click Login for unified authentication.
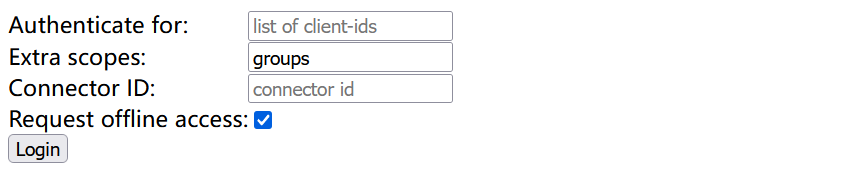
If authentication is successful, an ID Token will be generated, and the example is as shown below:
eyJhbGciOiJSUzI1NiIsImtpZCI6IjA2OGUyODFmN2FkYTk2NjNmMWI0MTc0NGFhYTUzZDRmYjk0N2Q1YjMifQ.eyJpc3MiOiJodHRwczovL2RleC5ibHV6aW4uaW86OTA4MCIsInN1YiI6IkNnSXhNaElHWjJsMGJHRmkiLCJhdWQiOiJwbGF0Zm9ybSIsImV4cCI6MTY4MDg3Mjc2MiwiaWF0IjoxNjgwNzg2MzYyLCJhdF9oYXNoIjoiWTNNbnRHLTE3SERaWjNVb0hiNWdmUSIsImNfaGFzaCI6IlBGUXNEM1hPSkhNZ1B3RW1LNXl5bEEiLCJlbWFpbCI6ImxpdWp1bmhvbmdAdmlzcHJhY3RpY2UuY29tIiwiZW1haWxfdmVyaWZpZWQiOnRydWUsImdyb3VwcyI6WyJ5dW50aSIsIm5hdXRlcy1sYWJzIiwidGVrdG9uY2QiLCJkZXYtdGVuYW50IiwieXVudGkvc3ViZ3JvdXAiLCJ5dW50aS9zdWJncm91cC9zdWJzdWJncm91cCJdLCJuYW1lIjoibGl1anVuaG9uZyIsInByZWZlcnJlZF91c2VybmFtZSI6ImxpdWp1bmhvbmcifQ.AYiLwJMcVaJdVdF-j_RZnHCPpg1psF3CJlzlBzvBYcuI_t7slgRaumRmGJEYXHYn2QFxjEZCNnBiOpJDDJoitVTxi1qoZ2nNoxhB3Wtxc1MoqkiPR5wy49yHw5roTnqIuEBy5BMpN_embxB9vK1bwxf414PsYKm1Dhbj8dynpURjpTsLrN5k7zVC7RQxVvglNX4cgYEucvSLqMEdtHNlmtnRsl6DJuItxC0MYwXlp4C9FNWswUjSpargdX4wgqfYy91l66GiI2Xj_zdba0NHLcPean-nmBMObLNhxex4hj8IVcGyiEu9in87y8eisrCBoLEWP9SJ_ZxWiOPoTFr54A
You can use the ID Token to replace the authentication information in kubeconfig:
# Replace the configuration of users in the kubeconfig file with the ID Token.
apiVersion: v1
clusters:
......
kind: Config
preferences: {}
users:
- name: user
  user:
    token: $ID-Token
If your runtime cluster type is virtual, you can obtain the kubeconfig file using the command line:
# Replace the $VCLUSTER variable with the name of the virtual cluster.
kubectl get secret vc-$VCLUSTER-vcluster -n $VCLUSTER --template={{.data.config}} | base64 -d
After applying the kubeconfig file, you can use the kubectl command line to view the resources in the namespace with the same name as the deployment runtime, and you have management permissions for all resources in the namespace.
# Apply the kubeconfig.
export KUBECONFIG=/opt/vcluster/kubeconfig-dex.yaml
# Use the kubectl command line to manage resources in the namespace. The following command lines are only examples.
kubectl get deployment -n deployment-runtime-1
kubectl delete deployment deployment-test -n deployment-runtime-1